
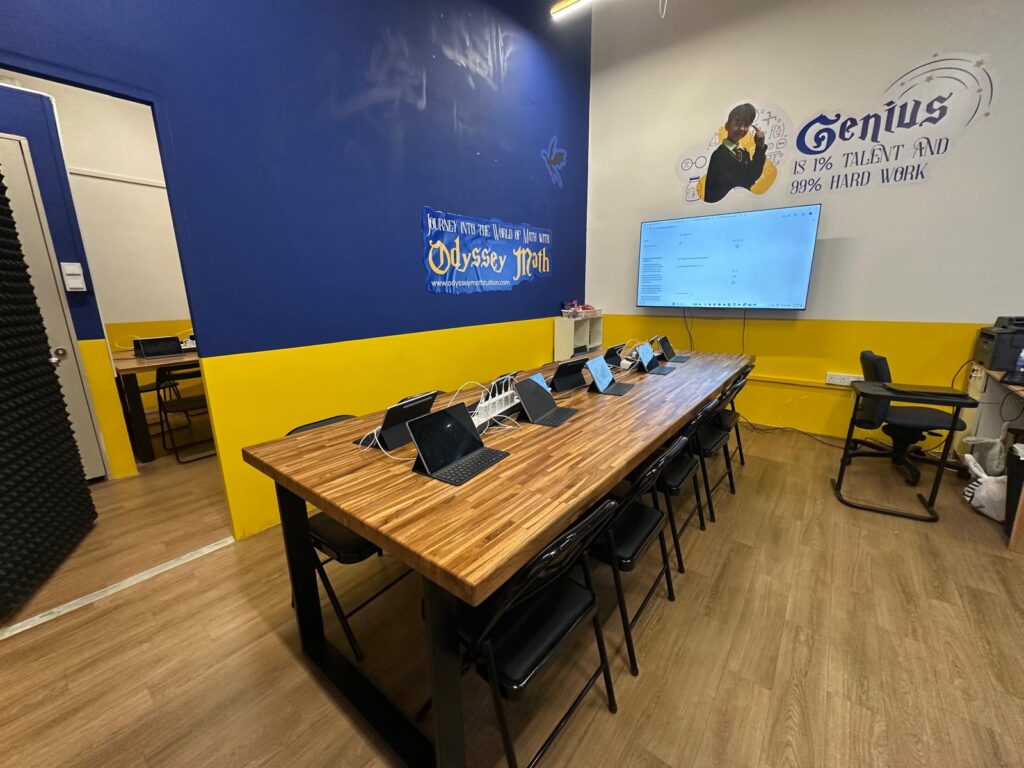
Statistical Diagrams and Averages is usually met around Secondary 2 — though schools sequence topics differently — and is covered in Odyssey Math Tuition’s online math course for that level, with recorded video lessons, a question bank, topical practice and a topical test. Most marks lost here come from execution errors rather than misunderstanding, which is why targeted practice works.
What statistical diagrams and averages actually asks of a student
This topic covers the three averages, measures of spread, and the diagrams used to present data — bar charts, pie charts, stem-and-leaf and dot diagrams.
Calculating an average is straightforward. The marks that get left behind are for interpretation: saying what the figure means, or why one average is more appropriate than another for a given data set.
What the topic assumes you already have
Most difficulty in this topic is not caused by the topic itself. It is caused by something earlier that never became fluent. Check these first:
- Careful arithmetic, particularly when totalling
- Ordering data accurately before finding a median
- Reading scales on diagrams precisely
- Ability to write a short conclusion in words
If any of these is shaky, repair it before going further. Working on new material while a prerequisite is unstable is how students spend hours and move nothing.
Where marks are actually lost
- Finding the median without ordering the data first
- Using the mean where an outlier makes the median more appropriate, without comment
- Misreading a scale on a diagram
- Computing correctly but not interpreting when the question asks what it shows
- Confusing frequency with the value itself in a stem-and-leaf diagram
Most of these are execution errors rather than gaps in understanding, which is encouraging: they respond to practice and to keeping a written record of the mistakes you personally repeat.
A revision approach that works
- Order every data set before touching it.
- For each average computed, write one sentence saying what it tells you.
- Practise identifying when an outlier makes the mean misleading.
- Read scales twice on diagram questions.
How the Secondary 2 course covers it
In the Secondary 2 online course this topic follows the same shape as every other: a recorded explanation, a question bank with answers worked through rather than printed, topical practice, and a topical test. Lessons are recorded personally by our founder, Mr. Justin Tan, and the course follows our own curriculum, aligned to the MOE syllabus.
The courses also include past-year school examination papers with worked answers, which shows how a topic is actually examined rather than how it is taught. Access is 24 hours a day with unlimited replays, and every online course carries a 7-day money-back guarantee.
Where this sits in the wider syllabus
For the year as a whole, see our guide to this stage. For the subject in context, this guide and this one cover what comes before and after.
Syllabus details follow Ministry of Education and SEAB published documents. Course details and prices are as published at the time of writing — check the course pages for current information. We do not promise grades.
Read next
Related reading on studying maths online: Linear Inequalities: A Secondary 2 Revision Guide, Expansion and Factorisation Using Special Identities: A Sec 2 Guide, Volume and Surface Area of Pyramids, Cones and Spheres: A Sec 2 Guide, The 7-Day Money-Back Guarantee, Explained, Vectors: A Secondary 4 E-Math Guide. On choosing a school at this stage, see our list of secondary schools in Singapore.
More on getting the most from your maths
Frequently asked questions
What does statistical diagrams and averages cover at Secondary 2?
This topic covers the three averages, measures of spread, and the diagrams used to present data — bar charts, pie charts, stem-and-leaf and dot diagrams.…
What should my child revise before this topic?
The prerequisites listed above. Most difficulty traces back to an earlier skill that never became fluent rather than to the topic itself.
Where do students lose the most marks?
Almost always in execution rather than understanding — sign errors, answering a different question from the one asked, or skipping the sketch.
Is this topic in the online course?
Yes. It is covered in the Secondary 2 online math course with video lessons, a question bank, topical practice and a topical test.
Can we access just this topic?
Yes. The courses are self-paced and non-linear, so a student can go straight to one topic without working through the rest.
Is there a trial period?
All online courses carry a 7-day money-back guarantee. The terms and conditions set out how it works.
Last reviewed July 2026. Syllabus details follow the Ministry of Education and SEAB published documents.